Acoustical monitoring and environmental correlates of bat activity

Summary
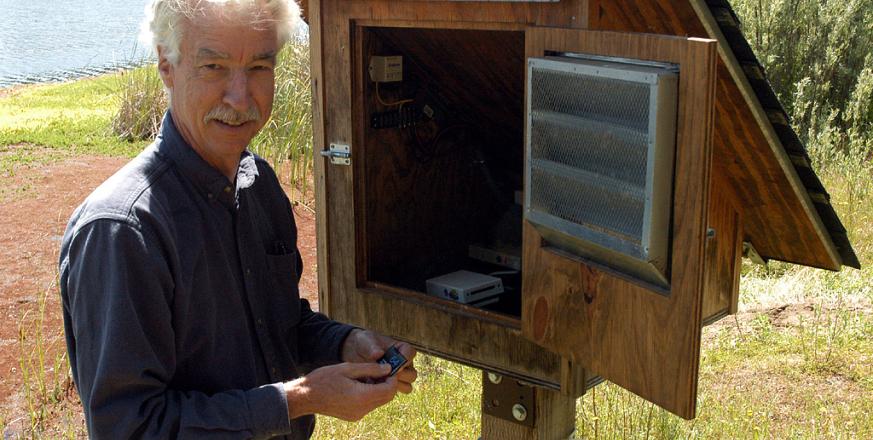
Since 2001, an acoustical monitoring station at the edge of Searsville Lake has recorded over ten million bat calls. These are calls emitted by bats during foraging to aid them in locating and capturing prey, and also emitted during other kinds of activity. This station was set up by Tom Mudd, who operated it with the goal of tracking and understanding the abundance and activity patterns of nine species of bats observed in the preserve. Tom passed away in 2007, but his colleagues and friends are continuing the study.
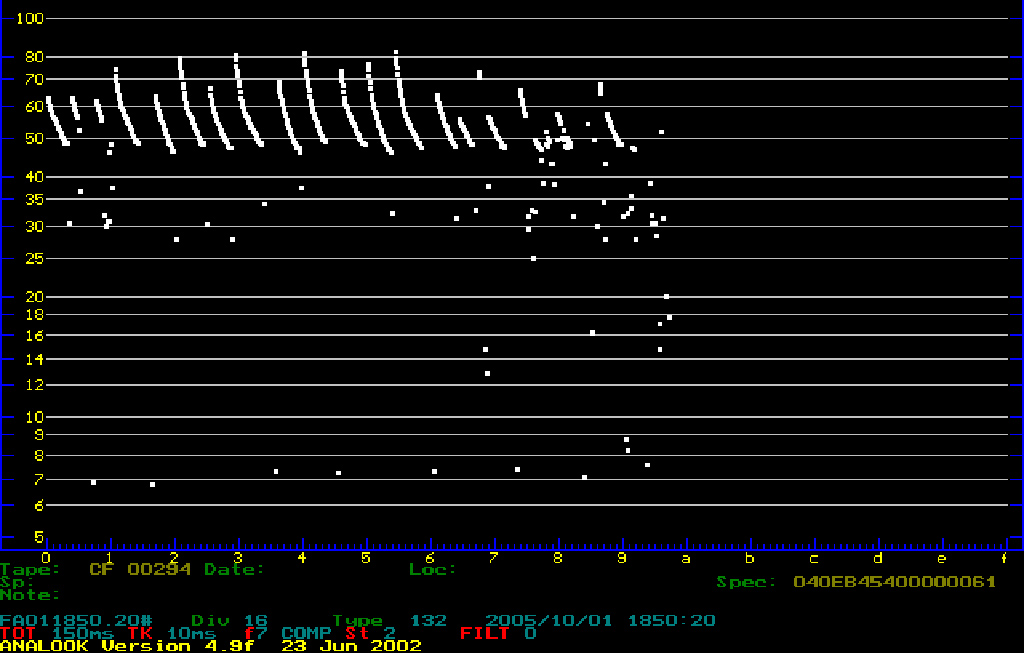
The station uses a detector (Anabat), which converts ultrasonic bat calls to audible output. Additional hardware (ZCAIM) converts this to an electrical signal, which can be analyzed to detect diagnostic fluctuations and store the time and frequencies of each call on a compact flash card. Calls vary among species and also within species as a function of different activities, such as commuting, searching, attacking, and feeding.
Tom documented seasonal differences in the abundance of different species, both for local species and migratory species, as well as differences among species in their hourly patterns of activity. To help explain activity patterns, Tom trapped insects nightly during three summers to analyze the abundance of different types of insect prey, and he compared bat activity with weather data.
The lake is an important foraging location for bats because it provides a year-round source of insect prey and is an acoustically simple environment for foraging. In 2000, Michelle Evelyn and David Stiles mist-netted bats in JRBP and radio-tagged them to track them to their roost sites. Four-fifths of the bats returned to roosts outside JRBP, some as far as three kilometers away. This showed that bats from a very large area utilize the lake and will likely be influenced by changes in the extent of open water as the lake fills in.
Project Location (Sector 30)
 |  |  |  |  |  |  |  |  |
 |  |  |  |  |  |  |  |  |
 |  |  |  |  |  |  |  |  |
 |  |  |  |  |  |  |  |  |
 |  |  |  |  |  |  |  |  |
 |  |  |  |  |  |  |  |  |


