
Whole-system gas exchange of the Jasper Ridge Global Change Experiment

Summary
A major gap in our understanding of how Earth's biosphere will respond to rising concentrations of atmospheric CO2 is whether ecosystems will increase their net uptake of CO2 through photosynthesis and growth, and if so, by how much. Since 1999, the Jasper Ridge global change experiment has found that elevated CO2 has a small negative effect, or none at all, on annual biomass production. To better understand this finding, PhD student Claire Lunch is monitoring the net exchange of CO2 by the vegetation, which reflects the balance between uptake of CO2 via photosynthesis and release of CO2 via respiration. She is also monitoring the loss of water vapor from the vegetation through the process of evapotranspiration.
Claire's studies test several possible explanations for the JRGCE results: Is the biomass of vegetation reduced at elevated CO2 because photosynthesis is suppressed? because respiration is enhanced? because the growing season is delayed? By also monitoring evapotranspiration, Claire will be able to tell how much of the change in photosynthesis is due to stomatal changes versus other aspects of leaf physiology.
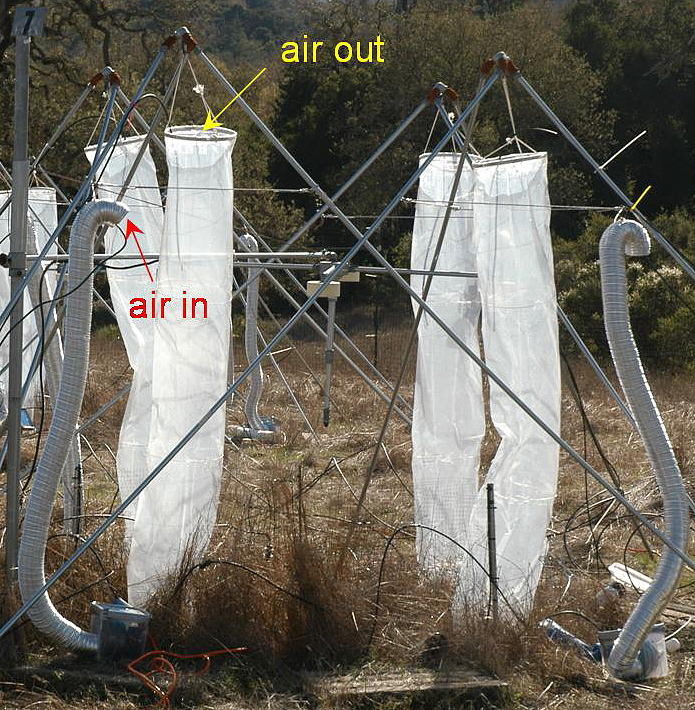
Claire's equipment includes 16 clear polyethylene sleeves rising up from the plots, each suspended from a six-foot tripod and connected to a feeder hose, a pump, and a pair of tubes for sampling air and carrying it to a gas analyzer, which measures the concentrations of water vapor and CO2. For each gas, the difference in concentration between the inlet and outlet, together with the flow rate, reflects the net amount taken up or released. The inlet hose is tall to insure that incoming air is a well-mixed average of the local air, and the outlet sleeve is even taller, to prevent outflowing air from cycling directly back to the inlet. Claire's equipment migrates through the experiment, spending five days on one set of 16 subplots, then moving to another set, and then another, until cycling back to the first set.
Project Location (Sector 30)
 |  |  |  |  |  |  |  |  |
 |  |  |  |  |  |  |  |  |
 |  |  |  |  |  |  |  |  |
 |  |  |  |  |  |  |  |  |
 |  |  |  |  |  |  |  |  |
 |  |  |  |  |  |  |  |  |